Explore
Featured
Recent
Articles
Topics
Login
Upload
Featured
Recent
Articles
Topics
Login
Upload
Search Results for 'skewed median'
skewed median published presentations and documents on DocSlides.
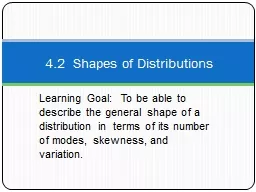
Learning Goal: To be able to describe the general shape of
by sherrill-nordquist
4.2 Shapes of Distributions. Number of Modes. On...
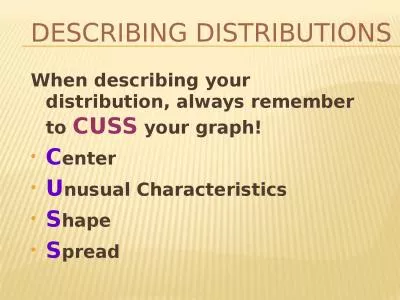
Describing Distributions
by roy
When describing your distribution, always remember...
Skewness Skewness is a measure of the asymmetry of a distribution. A distribution is asymmetrical w
by elise
In a distribution with right skew, the mean is alw...
statistical calculations
by carny
What Is Central You have tabulated your data. You...
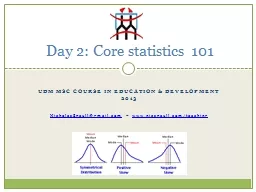
Day 2: Core statistics 101
by botgreat
2013. NicholasSpaull@gmail.com. – . www.nicspau...
Chapter 4 Displaying & Summarizing Quantitative Data
by alexa-scheidler
Histograms. Similar to bar charts, but with quant...
Chapter 4: Central Tendency
by pasty-toler
How do we quantify the ‘middle’ of a distribu...
Descriptive
by sherrill-nordquist
Statistics. Measures of Central Tendency. Measure...
How to describe a graph
by lois-ondreau
Otherwise called. CUSS. 1. Center. discuss where ...
2.4 Describing Distributions Numerically – cont.
by yoshiko-marsland
Describing Symmetric Data. Symmetric Data. Body t...
Week 2 Lecture 1 Chapter 3. Displaying and Summarizing Quantitative Data
by tatiana-dople
1. Graphical displays of a Quantitative data. 2. ...
STATS 250 Lab 2
by trish-goza
Julie Ghekas. jghekas@umich.edu. September 15, 20...
Quantitative Univariate EDA
by lindy-dunigan
Slide #. 1. Univariate EDA. Purpose – describe ...
AP Statistics
by debby-jeon
2.1 Density Curves and the Normal Distribution. D...
KNR 445
by alida-meadow
Statistics. t-tests. Slide . 1. Measures of Centr...
Load More...